We are coming into earnings season and accordingly we have the chance to look at the financial reporting of companies in our industry. IBM and Google both posted their numbers last week and that got me to thinking about one of my favorite subjects -- how companies choose to spend their money. Specifically I am interested in how much a company spends on sales and marketing, how that compares to engineering (R&D), and how they each compare to the amount of money a company has available.
We know that gross profit as the amount a company has available to spend on all things not associated with delivering their products or services to customers. There are essentially four places this money goes. General and Administrative, Sales and Marketing, Research and Development, and Profit. A company cannot survive without just the right balance of each of these four things. So I thought it would be interesting to take a look at how eight well known companies in the technology industry choose to spend their money.
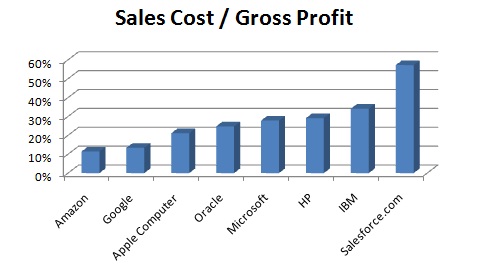
Here is a graph comparing the companies on sales cost as a percentage of gross profit. Google has made a big point that their products are so good they sell themselves. They clearly are backing that up with good performance. They are only spending 13% of their gross profit on sales and marketing. The only company spending less is Amazon at 11%. One could argue that insufficient investment is sales will show up in slower growth rates -- but both Google and Amazon are defying that with 8% and 20% growth rates respectively. Salesforce.com is also growing at 20%, but is spending 57% of its gross profit on sales and marketing. So I think you want to be on the left end of this chart -- spending enough to grow the company but not too much.
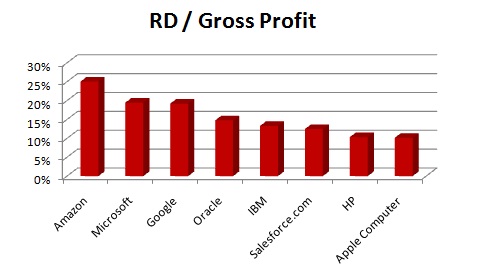
Anyone wishing to have products that are so good they can sell themselves should be investing in R and D. One of the highest impact decisions a CEO can make is allocating resources between sales and engineering. The temptation is to invest more in sales because the results will show up faster there. But a company that starves its engineering effort in order to invest in short term sales results will pay the piper later. Here is a graph showing R&D spending as a percentage of gross profit. I think the left side of the chart is where you want to be for long term health in the company.
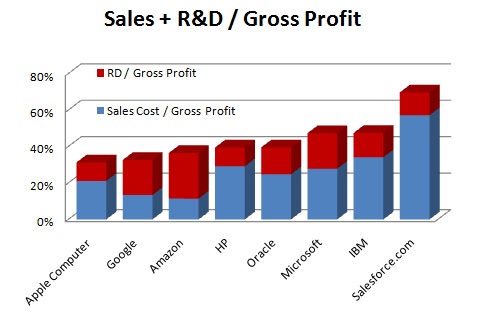
Once we add the two together, it is interesting to see that Apple, Google, and Amazon end up on the good (left) end of the chart. And all three of them are also turning in impressive growth numbers. The stock market agrees with this analysis because these three companies are on the high end of P/E ratios as well. Strangely, the highest P/E ratio of all is for Salesforce.com -- a staggering 110. I don't get this. To me it seems like Salesforce.com is having to try very hard to generate revenues by spending 57% of its gross profit on sales and is investing less than anyone in R&D. Could be a correction in the works there.
Finally, I think sales spending and engineering spending diverge in one significant area. Sales should always be compared to near term revenue, but investments in engineering can in some cases be disassociated with current revenues. In other words, size does matter here and this is where we see Microsoft flex its muscles. Microsoft is not spending the highest percentage of gross profit on R&D, but it is way ahead of the pack on total dollars committed -- over $9 Billion! This is a full 50% more than the next biggest number which is IBM -- who has 4 times the employees and two times the revenues.
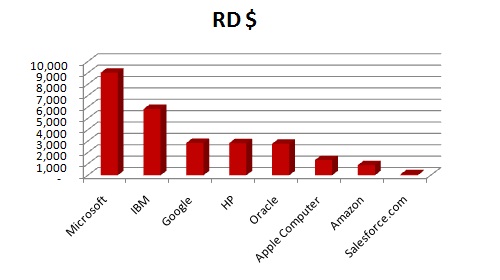
Microsoft is spending six times as much as Apple. So far Apple has been the premier innovator -- something that will be hard to forget this coming week. But don't count Microsoft out yet.